Phoenix Home Price Map by Zip Code: Where Prices Rose and Fell (2026)
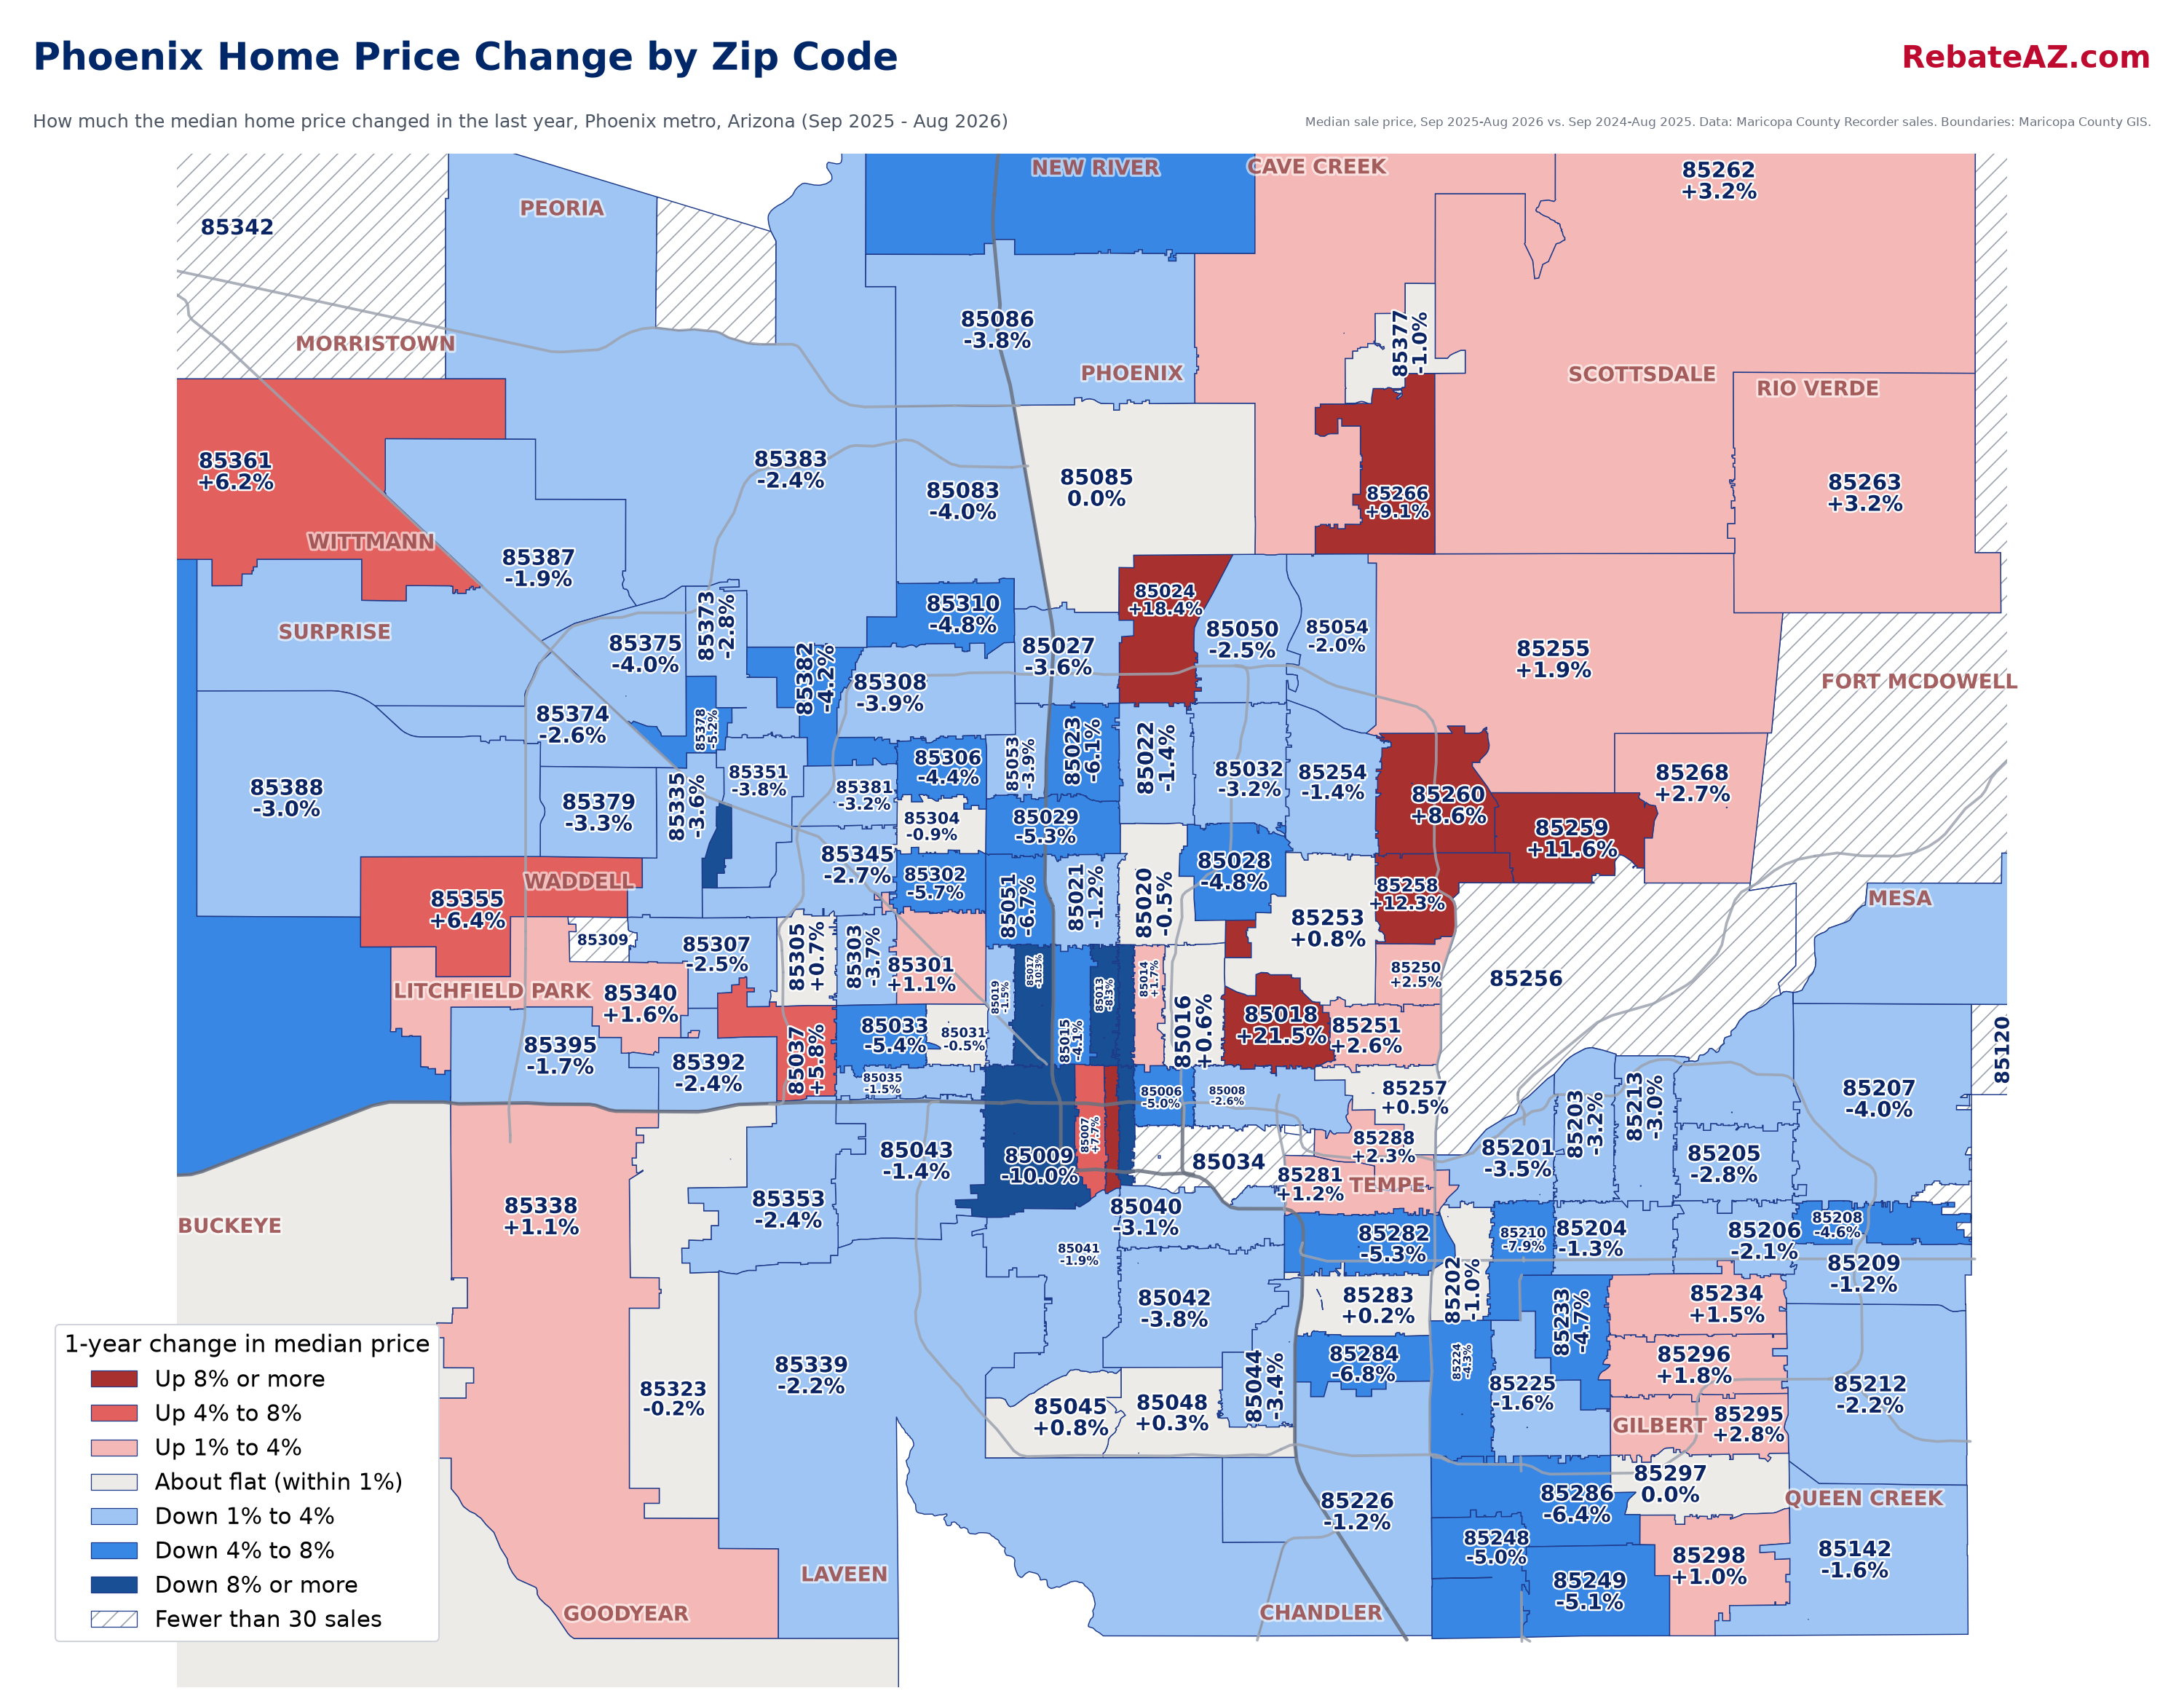
How much have home prices changed in your zip code? This map colors 124 Phoenix-area zip codes by the 1-year change in median sale price, using every recorded sale in Maricopa County. Switch the map to see median price, where cash buyers and investors are most active, and where FHA and VA buyers are winning homes. Tap any zip code for the full numbers.
Zip codes with a dashed outline had fewer than 30 sales. Zoom in to see zip numbers. A change in the median also reflects which homes sold (for example, a wave of new builds), so small zip codes can swing. The full table is below the map.
Text us the address of any home and we'll tell you your rebate in dollars.Licensed Arizona agents with HomeSmart. Read our Google reviews.
Text (602) 975-2727Zip Codes Where Prices Rose the Most
Largest 1-year change in median sale price, among zip codes with at least 100 sales.
| Zip | Area | 1-yr change | Median price | Sales |
|---|---|---|---|---|
| 85018 | Phoenix | +21.5% | $1,084,000 | 669 |
| 85024 | Phoenix | +18.4% | $585,965 | 438 |
| 85003 | Phoenix | +12.8% | $698,500 | 104 |
| 85258 | Scottsdale | +12.3% | $940,000 | 786 |
| 85259 | Scottsdale | +11.6% | $1,250,000 | 407 |
| 85266 | Scottsdale | +9.1% | $1,385,000 | 361 |
| 85260 | Scottsdale | +8.6% | $753,720 | 682 |
| 85007 | Phoenix | +7.7% | $490,000 | 113 |
| 85355 | Waddell | +6.4% | $500,000 | 639 |
| 85361 | Wittmann | +6.2% | $439,990 | 257 |
Zip Codes Where Prices Fell the Most
A falling median can mean more room to negotiate, more seller credits, and a bigger buyer rebate staying in your pocket. Same 100-sale minimum.
| Zip | Area | 1-yr change | Median price | Sales |
|---|---|---|---|---|
| 85363 | Youngtown | -13.2% | $330,000 | 119 |
| 85012 | Phoenix | -12.2% | $467,500 | 108 |
| 85017 | Phoenix | -10.3% | $295,000 | 185 |
| 85009 | Phoenix | -10.0% | $280,000 | 218 |
| 85013 | Phoenix | -8.3% | $500,000 | 260 |
| 85210 | Mesa | -7.9% | $350,000 | 274 |
| 85396 | Buckeye | -7.9% | $465,000 | 1,404 |
| 85087 | New River | -7.2% | $610,000 | 167 |
| 85284 | Tempe | -6.8% | $685,000 | 213 |
| 85051 | Phoenix | -6.7% | $335,000 | 374 |
Where Cash Buyers Are Most Active
Share of sales paid all cash. Retirement communities and investor-heavy areas lead. If you are financing in these zip codes, a clean offer and a strong preapproval matter more.
| Zip | Area | Paid cash | Median price | Sales |
|---|---|---|---|---|
| 85263 | Rio Verde | 58% | $847,000 | 227 |
| 85262 | Scottsdale | 50% | $1,600,000 | 514 |
| 85377 | Carefree | 50% | $1,054,625 | 115 |
| 85266 | Scottsdale | 49% | $1,385,000 | 361 |
| 85375 | Sun City West | 49% | $359,900 | 1,086 |
| 85253 | Paradise Valley | 47% | $3,420,000 | 416 |
| 85390 | Wickenburg | 46% | $366,250 | 192 |
| 85255 | Scottsdale | 45% | $1,477,450 | 1,186 |
| 85054 | Phoenix | 44% | $674,995 | 206 |
| 85258 | Scottsdale | 44% | $940,000 | 786 |
Where LLC and Investor Buyers Are Most Active
Share of homes where the buyer on the deed is a company: an LLC, corporation or similar business name. That includes investors, flippers and rental companies.
| Zip | Area | Bought by a company | Median price | Sales |
|---|---|---|---|---|
| 85253 | Paradise Valley | 31% | $3,420,000 | 416 |
| 85251 | Scottsdale | 27% | $590,000 | 748 |
| 85254 | Scottsdale | 24% | $899,950 | 942 |
| 85017 | Phoenix | 23% | $295,000 | 185 |
| 85018 | Phoenix | 23% | $1,084,000 | 669 |
| 85006 | Phoenix | 22% | $435,000 | 197 |
| 85257 | Scottsdale | 22% | $589,000 | 473 |
| 85009 | Phoenix | 20% | $280,000 | 218 |
| 85033 | Phoenix | 20% | $320,000 | 369 |
| 85281 | Tempe | 20% | $425,000 | 297 |
Where FHA and VA Buyers Win Homes
Zip codes where FHA loans make up the biggest share of sales. Sellers here see low-down-payment offers every day. Thinking about assistance programs? See Arizona first time home buyer programs.
| Zip | Area | FHA share | Median price | Sales |
|---|---|---|---|---|
| 85326 | Buckeye | 52% | $389,990 | 1,977 |
| 85353 | Tolleson | 50% | $410,000 | 465 |
| 85323 | Avondale | 49% | $420,000 | 538 |
| 85354 | Tonopah | 44% | $415,000 | 176 |
| 85037 | Phoenix | 41% | $412,500 | 803 |
| 85035 | Phoenix | 38% | $330,000 | 275 |
| 85043 | Phoenix | 38% | $365,000 | 254 |
| 85335 | El Mirage | 37% | $345,000 | 286 |
| 85031 | Phoenix | 35% | $325,500 | 150 |
| 85363 | Youngtown | 35% | $330,000 | 119 |
Top zip codes for VA loans:
| Zip | Area | VA share | Median price | Sales |
|---|---|---|---|---|
| 85355 | Waddell | 20% | $500,000 | 639 |
| 85388 | Surprise | 15% | $485,990 | 703 |
| 85361 | Wittmann | 14% | $439,990 | 257 |
| 85379 | Surprise | 14% | $435,000 | 679 |
| 85338 | Goodyear | 13% | $465,000 | 1,821 |
| 85340 | Litchfield Park | 13% | $543,642 | 778 |
| 85387 | Surprise | 12% | $446,400 | 2,323 |
| 85396 | Buckeye | 11% | $465,000 | 1,404 |
| 85335 | El Mirage | 10% | $345,000 | 286 |
| 85392 | Avondale | 10% | $430,000 | 465 |
Price Change Map Image
All Zip Codes: Prices and How Buyers Paid
Tap a column to sort. Tap a zip code to see it on the map. For neighborhood outlines and city lists, see the Maricopa County zip code map.
| Zip | Area | Median | 1-yr change | Sales | Cash | Company | FHA | VA | Conv. |
|---|---|---|---|---|---|---|---|---|---|
| 85003 | Phoenix | $698,500 | +12.8% | 104 | 28% | 13% | 1% | 4% | 55% |
| 85004 | Phoenix | $450,000 | -17.1% | 51 | 33% | 18% | 4% | 0% | 53% |
| 85006 | Phoenix | $435,000 | -5.0% | 197 | 16% | 22% | 8% | 3% | 62% |
| 85007 | Phoenix | $490,000 | +7.7% | 113 | 19% | 19% | 11% | 9% | 50% |
| 85008 | Phoenix | $375,000 | -2.6% | 278 | 17% | 19% | 13% | 5% | 52% |
| 85009 | Phoenix | $280,000 | -10.0% | 218 | 13% | 20% | 24% | 1% | 37% |
| 85012 | Phoenix | $467,500 | -12.2% | 108 | 36% | 6% | 3% | 4% | 54% |
| 85013 | Phoenix | $500,000 | -8.3% | 260 | 22% | 15% | 5% | 3% | 62% |
| 85014 | Phoenix | $479,000 | +1.7% | 323 | 24% | 17% | 4% | 4% | 59% |
| 85015 | Phoenix | $350,000 | -4.1% | 332 | 17% | 18% | 13% | 3% | 53% |
| 85016 | Phoenix | $561,500 | +0.6% | 610 | 34% | 16% | 3% | 1% | 52% |
| 85017 | Phoenix | $295,000 | -10.3% | 185 | 14% | 23% | 23% | 3% | 41% |
| 85018 | Phoenix | $1,084,000 | +21.5% | 669 | 31% | 23% | 1% | 1% | 58% |
| 85019 | Phoenix | $335,000 | -1.5% | 179 | 11% | 16% | 26% | 3% | 48% |
| 85020 | Phoenix | $418,000 | -0.5% | 543 | 24% | 13% | 6% | 3% | 59% |
| 85021 | Phoenix | $425,000 | -1.2% | 327 | 17% | 16% | 11% | 3% | 57% |
| 85022 | Phoenix | $440,000 | -1.4% | 527 | 21% | 10% | 8% | 5% | 61% |
| 85023 | Phoenix | $422,500 | -6.1% | 349 | 16% | 11% | 13% | 5% | 58% |
| 85024 | Phoenix | $585,965 | +18.4% | 438 | 13% | 4% | 7% | 4% | 73% |
| 85027 | Phoenix | $370,000 | -3.6% | 422 | 14% | 11% | 16% | 6% | 57% |
| 85028 | Phoenix | $690,000 | -4.8% | 347 | 24% | 18% | 2% | 1% | 61% |
| 85029 | Phoenix | $360,000 | -5.3% | 463 | 12% | 15% | 25% | 4% | 47% |
| 85031 | Phoenix | $325,500 | -0.5% | 150 | 15% | 17% | 35% | 0% | 34% |
| 85032 | Phoenix | $455,000 | -3.2% | 811 | 21% | 15% | 6% | 3% | 61% |
| 85033 | Phoenix | $320,000 | -5.4% | 369 | 10% | 20% | 30% | 1% | 43% |
| 85035 | Phoenix | $330,000 | -1.5% | 275 | 9% | 17% | 38% | 3% | 39% |
| 85037 | Phoenix | $412,500 | +5.8% | 803 | 7% | 6% | 41% | 7% | 40% |
| 85040 | Phoenix | $348,000 | -3.1% | 241 | 11% | 12% | 27% | 7% | 44% |
| 85041 | Phoenix | $378,500 | -1.9% | 542 | 12% | 10% | 28% | 5% | 47% |
| 85042 | Phoenix | $410,000 | -3.8% | 495 | 15% | 9% | 18% | 7% | 49% |
| 85043 | Phoenix | $365,000 | -1.4% | 254 | 9% | 10% | 38% | 6% | 37% |
| 85044 | Phoenix | $473,112 | -3.4% | 510 | 18% | 6% | 7% | 5% | 64% |
| 85045 | Phoenix | $655,000 | +0.8% | 137 | 19% | 4% | 2% | 4% | 71% |
| 85048 | Phoenix | $576,500 | +0.3% | 431 | 16% | 8% | 5% | 7% | 65% |
| 85050 | Phoenix | $585,000 | -2.5% | 462 | 22% | 6% | 5% | 2% | 68% |
| 85051 | Phoenix | $335,000 | -6.7% | 374 | 14% | 15% | 26% | 4% | 44% |
| 85053 | Phoenix | $370,000 | -3.9% | 307 | 14% | 11% | 24% | 7% | 46% |
| 85054 | Phoenix | $674,995 | -2.0% | 206 | 44% | 6% | 2% | 3% | 50% |
| 85083 | Phoenix | $612,000 | -4.0% | 266 | 19% | 7% | 5% | 6% | 67% |
| 85085 | Phoenix | $645,000 | 0.0% | 500 | 27% | 7% | 3% | 3% | 65% |
| 85086 | Phoenix | $600,000 | -3.8% | 695 | 30% | 6% | 5% | 5% | 56% |
| 85087 | New River | $610,000 | -7.2% | 167 | 23% | 5% | 11% | 7% | 56% |
| 85142 | Queen Creek | $669,195 | -1.6% | 1,613 | 18% | 4% | 6% | 8% | 65% |
| 85201 | Mesa | $337,598 | -3.5% | 348 | 20% | 13% | 17% | 5% | 49% |
| 85202 | Mesa | $395,000 | -1.0% | 427 | 13% | 12% | 15% | 3% | 59% |
| 85203 | Mesa | $450,000 | -3.2% | 356 | 14% | 13% | 16% | 4% | 58% |
| 85204 | Mesa | $395,000 | -1.3% | 454 | 13% | 12% | 23% | 5% | 50% |
| 85205 | Mesa | $388,881 | -2.8% | 548 | 22% | 8% | 13% | 7% | 52% |
| 85206 | Mesa | $362,204 | -2.1% | 597 | 36% | 8% | 9% | 5% | 45% |
| 85207 | Mesa | $547,000 | -4.0% | 697 | 27% | 12% | 7% | 6% | 55% |
| 85208 | Mesa | $365,000 | -4.6% | 471 | 26% | 9% | 18% | 8% | 42% |
| 85209 | Mesa | $425,000 | -1.2% | 690 | 34% | 5% | 9% | 5% | 49% |
| 85210 | Mesa | $350,000 | -7.9% | 274 | 18% | 15% | 19% | 3% | 51% |
| 85212 | Mesa | $562,456 | -2.2% | 1,159 | 16% | 4% | 12% | 7% | 63% |
| 85213 | Mesa | $569,000 | -3.0% | 430 | 20% | 7% | 9% | 7% | 61% |
| 85215 | Mesa | $495,000 | -3.9% | 339 | 33% | 6% | 5% | 5% | 53% |
| 85224 | Chandler | $450,000 | -4.3% | 459 | 18% | 7% | 15% | 6% | 55% |
| 85225 | Chandler | $450,000 | -1.6% | 650 | 14% | 10% | 12% | 5% | 62% |
| 85226 | Chandler | $494,250 | -1.2% | 354 | 18% | 7% | 8% | 2% | 68% |
| 85233 | Gilbert | $505,000 | -4.7% | 433 | 17% | 10% | 7% | 6% | 63% |
| 85234 | Gilbert | $558,000 | +1.5% | 576 | 18% | 9% | 7% | 6% | 63% |
| 85248 | Chandler / Sun Lakes | $525,000 | -5.0% | 831 | 39% | 6% | 2% | 5% | 51% |
| 85249 | Chandler | $683,000 | -5.1% | 738 | 25% | 5% | 4% | 6% | 63% |
| 85250 | Scottsdale | $615,000 | +2.5% | 460 | 37% | 15% | 1% | 1% | 54% |
| 85251 | Scottsdale | $590,000 | +2.6% | 748 | 40% | 27% | 1% | 2% | 48% |
| 85253 | Paradise Valley | $3,420,000 | +0.8% | 416 | 47% | 31% | 1% | 0% | 46% |
| 85254 | Scottsdale | $899,950 | -1.4% | 942 | 27% | 24% | 0% | 2% | 59% |
| 85255 | Scottsdale | $1,477,450 | +1.9% | 1,186 | 45% | 14% | 0% | 1% | 47% |
| 85257 | Scottsdale | $589,000 | +0.5% | 473 | 22% | 22% | 3% | 2% | 63% |
| 85258 | Scottsdale | $940,000 | +12.3% | 786 | 44% | 19% | 1% | 1% | 46% |
| 85259 | Scottsdale | $1,250,000 | +11.6% | 407 | 34% | 15% | 0% | 3% | 58% |
| 85260 | Scottsdale | $753,720 | +8.6% | 682 | 38% | 17% | 0% | 2% | 53% |
| 85262 | Scottsdale | $1,600,000 | +3.2% | 514 | 50% | 11% | 1% | 1% | 45% |
| 85263 | Rio Verde | $847,000 | +3.2% | 227 | 58% | 3% | 1% | 1% | 39% |
| 85266 | Scottsdale | $1,385,000 | +9.1% | 361 | 49% | 10% | 0% | 1% | 44% |
| 85268 | Fountain Hills | $719,000 | +2.7% | 687 | 40% | 8% | 1% | 3% | 52% |
| 85281 | Tempe | $425,000 | +1.2% | 297 | 30% | 20% | 4% | 2% | 57% |
| 85282 | Tempe | $450,000 | -5.3% | 487 | 22% | 17% | 8% | 5% | 60% |
| 85283 | Tempe / Guadalupe | $461,000 | +0.2% | 398 | 16% | 15% | 9% | 5% | 62% |
| 85284 | Tempe | $685,000 | -6.8% | 213 | 25% | 10% | 1% | 2% | 66% |
| 85286 | Chandler | $585,000 | -6.4% | 518 | 20% | 6% | 5% | 5% | 67% |
| 85288 | Tempe | $395,000 | +2.3% | 113 | 27% | 12% | 7% | 2% | 58% |
| 85295 | Gilbert | $550,000 | +2.8% | 600 | 21% | 7% | 7% | 5% | 65% |
| 85296 | Gilbert | $569,950 | +1.8% | 654 | 18% | 9% | 6% | 3% | 70% |
| 85297 | Gilbert | $610,000 | 0.0% | 410 | 18% | 5% | 6% | 5% | 67% |
| 85298 | Gilbert | $722,000 | +1.0% | 776 | 22% | 5% | 2% | 5% | 69% |
| 85301 | Glendale | $288,000 | +1.1% | 332 | 13% | 14% | 29% | 2% | 42% |
| 85302 | Glendale | $380,000 | -5.7% | 421 | 11% | 11% | 26% | 6% | 48% |
| 85303 | Glendale | $390,000 | -3.7% | 267 | 7% | 7% | 31% | 6% | 51% |
| 85304 | Glendale | $406,500 | -0.9% | 282 | 12% | 11% | 22% | 6% | 54% |
| 85305 | Glendale | $510,000 | +0.7% | 195 | 12% | 6% | 15% | 6% | 64% |
| 85306 | Glendale | $410,000 | -4.4% | 282 | 12% | 7% | 23% | 5% | 54% |
| 85307 | Glendale | $390,000 | -2.5% | 103 | 12% | 7% | 29% | 5% | 50% |
| 85308 | Glendale | $460,000 | -3.9% | 787 | 17% | 10% | 13% | 5% | 58% |
| 85310 | Glendale | $514,000 | -4.8% | 231 | 20% | 11% | 10% | 6% | 58% |
| 85323 | Avondale | $420,000 | -0.2% | 538 | 7% | 5% | 49% | 7% | 32% |
| 85326 | Buckeye | $389,990 | 0.0% | 1,977 | 7% | 3% | 52% | 9% | 29% |
| 85331 | Cave Creek | $852,500 | +2.4% | 626 | 34% | 6% | 2% | 4% | 55% |
| 85335 | El Mirage | $345,000 | -3.6% | 286 | 10% | 5% | 37% | 10% | 38% |
| 85338 | Goodyear | $465,000 | +1.1% | 1,821 | 12% | 3% | 32% | 13% | 41% |
| 85339 | Laveen | $466,385 | -2.2% | 849 | 8% | 3% | 33% | 8% | 48% |
| 85340 | Litchfield Park | $543,642 | +1.6% | 778 | 19% | 4% | 14% | 13% | 52% |
| 85345 | Peoria | $365,000 | -2.7% | 642 | 13% | 9% | 28% | 7% | 46% |
| 85351 | Sun City | $255,000 | -3.8% | 1,123 | 40% | 7% | 8% | 7% | 41% |
| 85353 | Tolleson | $410,000 | -2.4% | 465 | 5% | 5% | 50% | 6% | 34% |
| 85354 | Tonopah | $415,000 | -1.2% | 176 | 4% | 1% | 44% | 5% | 43% |
| 85355 | Waddell | $500,000 | +6.4% | 639 | 9% | 3% | 33% | 20% | 37% |
| 85361 | Wittmann | $439,990 | +6.2% | 257 | 12% | 5% | 30% | 14% | 41% |
| 85363 | Youngtown | $330,000 | -13.2% | 119 | 8% | 6% | 35% | 8% | 41% |
| 85373 | Sun City / Peoria | $345,000 | -2.8% | 431 | 37% | 5% | 7% | 8% | 45% |
| 85374 | Surprise | $379,000 | -2.6% | 911 | 38% | 4% | 9% | 7% | 43% |
| 85375 | Sun City West | $359,900 | -4.0% | 1,086 | 49% | 4% | 3% | 6% | 39% |
| 85377 | Carefree | $1,054,625 | -1.0% | 115 | 50% | 6% | 0% | 2% | 43% |
| 85378 | Surprise | $345,000 | -5.2% | 125 | 18% | 6% | 22% | 7% | 50% |
| 85379 | Surprise | $435,000 | -3.3% | 679 | 14% | 6% | 21% | 14% | 47% |
| 85381 | Peoria | $450,000 | -3.2% | 308 | 17% | 7% | 16% | 6% | 56% |
| 85382 | Peoria | $435,000 | -4.2% | 625 | 29% | 8% | 8% | 7% | 52% |
| 85383 | Peoria | $655,133 | -2.4% | 1,670 | 26% | 4% | 4% | 7% | 61% |
| 85387 | Surprise | $446,400 | -1.9% | 2,323 | 14% | 2% | 28% | 12% | 45% |
| 85388 | Surprise | $485,990 | -3.0% | 703 | 18% | 6% | 14% | 15% | 50% |
| 85390 | Wickenburg | $366,250 | -5.5% | 192 | 46% | 12% | 9% | 5% | 36% |
| 85392 | Avondale | $430,000 | -2.4% | 465 | 11% | 6% | 26% | 10% | 48% |
| 85395 | Goodyear | $532,061 | -1.7% | 719 | 34% | 4% | 8% | 10% | 46% |
| 85396 | Buckeye | $465,000 | -7.9% | 1,404 | 29% | 2% | 15% | 11% | 44% |
Questions
Are home prices going down in Phoenix?
Across the 124 Phoenix-area zip codes on this map, the median sale price was $475,000 from September 2025 through August 2026, versus $485,000 the year before (-2.1%). Prices were not falling everywhere: 28 zip codes saw the median rise at least 1%, 82 fell at least 1%, and 14 were roughly flat.
Which Phoenix zip codes had the biggest price increases?
Among zip codes with at least 100 sales, the largest 1-year increases in median price were 85018 (Phoenix, +21.5%), 85024 (Phoenix, +18.4%), 85003 (Phoenix, +12.8%), 85258 (Scottsdale, +12.3%), 85259 (Scottsdale, +11.6%). A change in the median also reflects which homes sold, so check the sales count and look at individual comps before reading too much into one zip.
Where do cash buyers buy the most in the Phoenix area?
The highest shares of cash purchases among zip codes with at least 100 sales were 85263 (Rio Verde, 58%), 85262 (Scottsdale, 50%), 85377 (Carefree, 50%), 85266 (Scottsdale, 49%), 85375 (Sun City West, 49%). Retirement communities and investor-heavy areas lead. In those zip codes, financed buyers often compete with cash offers.
Which zip codes have the most investor or LLC buyers?
Homes bought by a company (an LLC, corporation or similar name on the deed) were most common in 85253 (Paradise Valley, 31%), 85251 (Scottsdale, 27%), 85254 (Scottsdale, 24%), 85017 (Phoenix, 23%), 85018 (Phoenix, 23%), among zip codes with at least 100 sales.
Where do the most FHA buyers buy?
FHA loans were the largest share of sales in 85326 (Buckeye, 52%), 85353 (Tolleson, 50%), 85323 (Avondale, 49%), 85354 (Tonopah, 44%), 85037 (Phoenix, 41%). A high FHA share usually means sellers there are used to FHA offers and lower down payments.
Where does this data come from?
Every number comes from Maricopa County Recorder affidavits of property value for single family homes, condos and townhomes sold for $100,000 to $10 million, September 2025 through August 2026, compared with the prior 12 months. Zip codes need at least 30 sales to appear. Company buyers are deeds where the buyer's name is an LLC, corporation or similar business name.
Sources: Maricopa County Recorder affidavits of property value (single family, condo and townhouse sales, $100,000 to $10 million, multi-parcel sales excluded), September 2024 to August 2026. Zip code boundaries: Maricopa County GIS. See how we research our numbers. Map © OpenStreetMap contributors.
Send us the area or a home. We will tell you your rebate in dollars and pull the recent sales, with no per-showing fees.
Check My Rebate →Get Started
Tell us what you are looking for and we will text you shortly with a realistic rebate estimate and answers to your questions.
We will text you shortly from (602) 975-2727. If it is after 9 PM, we will text you in the morning.
Prefer to talk? Text or call (602) 975-2727